By Justin Morris
Could you ever live in a house that collapsed on itself? Probably not. To begin living there, we would have to rebuild the house by adding more space between the walls, ceiling, and floor. By the same token, soil life cannot live in soils that have collapsed where there is no place for them to live. They need enough space provided by good soil structure to live and grow. And because healthy soil structure is so important to creating resiliency to droughts and floods, as well as providing nutrients for growing our food, healthy soil structure is the house of life!
What is Soil Structure?
Soil structure is the arrangement of individual soil particles and the space between them. Soil microorganisms fed by sugars released by plant roots group soil particles together into larger units called aggregates. Soil structure can vary from granular where there is a lot of space between aggregates (think cottage cheese or a fluffy chocolate cake; see Photo 1) to being very tight and compact where there is very little to no space between soil particles and no aggregates are visible (see Photo 2).
Why is soil structure so important?
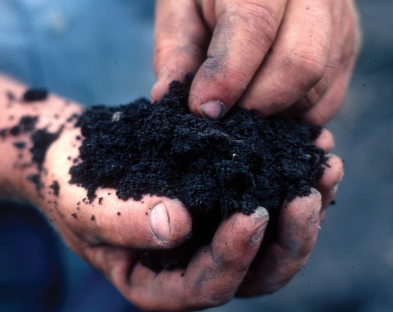
Photo 1: Healthy soil has a granular or crumbly structure. Photo: USDA-NRCS
Agriculture is the conversion of solar energy into harvestable, life-giving energy. Solar energy is captured by plants, which release that energy in the form of biochemical compounds to soil life. Soil life produces glue-like compounds that enable sand, silt, and clay particles to rearrange while also bringing nutrients to plant roots. As soil particles rearrange during the aggregation process, cavities called pores are created. Pores allow soil to infiltrate and hold water that’s essential for plants and soil life. Pores also allow air to get into the soil so soil life and roots can breathe while allowing carbon dioxide to be released from the soil. Carbon dioxide rising out of the soil is captured by plants so photosynthesis can continue. Life on earth is dependent on a healthy soil with a granular or crumbly structure that promotes the capture and release of water and
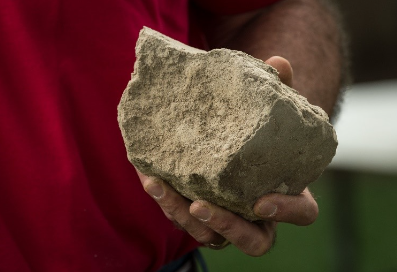
Photo 2: Unhealthy soil with no visible aggregates. Photo: USDA-NRCS
promotes the exchange of gases. In short, a granular soil structure allows soil life and plants to drink and breathe.
Think of soil structure like a house. The wood, concrete, and steel that make up the foundation, floor, walls, and ceiling are like sand, silt, and clay particles. The nails, screws, and staples are like the glue-like compounds secreted by plant roots and soil life. With nails, screws, and staples in place, the house has lots of room to live inside. But if a large earthmover moves through the house, the house collapses and the livable room inside the house is eliminated. Similarly, when tillage or another disturbance happens too frequently, the soil structure collapses on itself. Collapsed soil structure diminishes the habitat soil life needed to obtain nutrients for plants and to facilitate water infiltration and air movement.
What are the key practices that can improve soil structure?
Practices that can facilitate improved soil structure include the following:
- Reduced tillage, strip tillage, or no-till
- Three or more crops in rotation from three different plant families
- Cover crop mixtures with at least eight plant species and three plant families
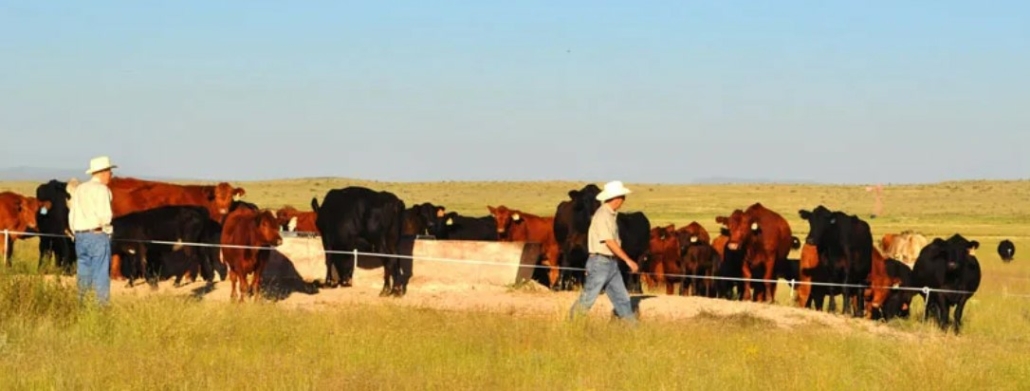
- Grazing perennial pastures that focuses on: 1) adequate leaf area post-grazing; and 2) full plant recovery pre-grazing
- Grazing cover crop mixtures on cropland where possible
- Mulching
- Controlled traffic farming
- Converting annual cropland to perennial mixtures
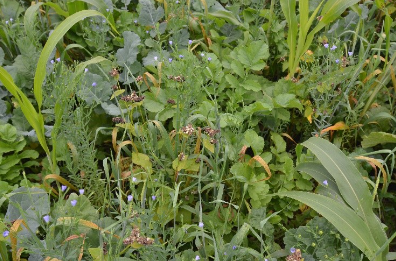
Photo 3: Nine species cover crop mixture. Photo: USDA-NRCS
Healthy soil structure is the house of life. As we focus on improving the life in our soils, that same soil life can begin creating healthy soil structure with plenty of space within and between soil aggregates. This can give us healthy food plus resilience to droughts and floods. That sounds like a win-win-win!
Related ATTRA Resources
Building Healthy Pasture Soils – ATTRA – Sustainable Agriculture (ncat.org)
Soil – ATTRA – Sustainable Agriculture (ncat.org)
Grazing – ATTRA – Sustainable Agriculture (ncat.org)
This publication is produced by the National Center for Appropriate Technology through the ATTRA Sustainable Agriculture program, under a cooperative agreement with USDA Rural Development. ATTRA.NCAT.ORG.