Using Web Soil Survey to Learn Your Land’s Potential
By Justin Morris, NCAT Regenerative Grazing Specialist
Have you ever wondered where the best place is to get information on the soils for your land? What if that information could tell you what kind of soil you have, how deep it is, how much water it could hold, or how much forage could be grown on each acre of your land in a year. Fortunately, there is such a source. It’s called the Web Soil Survey and you can access it from any laptop or desktop.
Launched in 2006 by the Natural Resources Conservation Service, the Web Soil Survey allows anyone to define any area they’re interested in within the United States and retrieve all sorts of soil-related information about that area. Here’s just a small sampling of what can be found:
- Soil map unit symbol and name
- Acres of a specific soil map unit within a defined area
- Soil textures in the top five feet
- Available water supply in inches for the top five feet
- Land capability classification
- Average annual precipitation
- Frost-free period
- Rangeland production during favorable, normal, and unfavorable years
- Yields of irrigated and non-irrigated crops including pasture and hayland
- And much, much more!
For those of you who are familiar with the hard copies of the soil survey, those are no longer available. Once you get used to using the Web Soil Survey interface, getting just the information you need without combing through a thick hard copy page by page becomes far easier to use and more accurate. And for those who still want a hard copy of something, not to worry. Everything in Web Soil Survey can be printed.
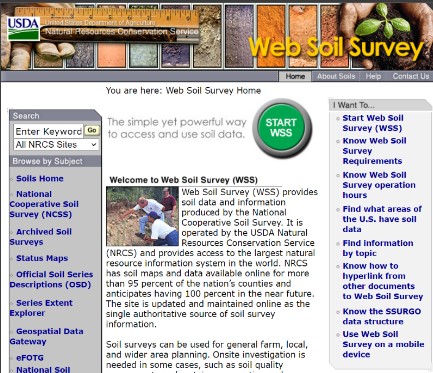
You can get started with Web Soil Survey. Once there, click on the big green “Start WSS” button. You’ll see a map of the lower 48 states with several tool buttons just above and to the left of the map. If you happen to be interested in an area in Alaska, Hawaii, or Puerto Rico, just click on the white hand tool to pan to those areas.
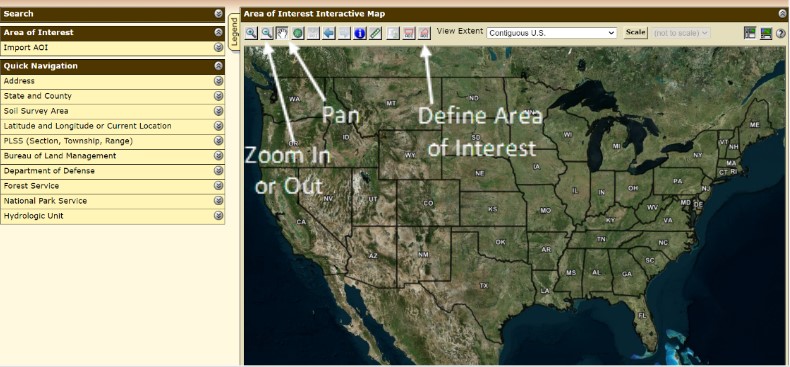
Alternatively, you can jump to any area by moving your cursor over to the menu bar at the far left and clicking on Address or State and County.
Once you’ve found the area you’re interested in, you can zoom in by using the cursor to select the magnifying lens with the plus symbol inside it. After clicking on the magnifying lens, move the cursor over the map and you’ll notice that the cursor turned into a plus symbol instead of an arrow. Click and drag over the area you want to see in greater detail. If you need to adjust the map east, west, north, or south to get everything in full view, click on the hand button to move the map image.
Now that you have the area you’re interested in and it’s filling up the entire interactive map view, click on one of two AOI toolbar buttons above the map. The AOI (Area of Interest) button on the left makes a rectangle, whereas the AOI button on the right makes a polygon of nearly any shape. Because field boundaries are rarely ever straight, I almost always select the polygon button. Click around the area you’re interested in and then double-click your mouse to finish the polygon.
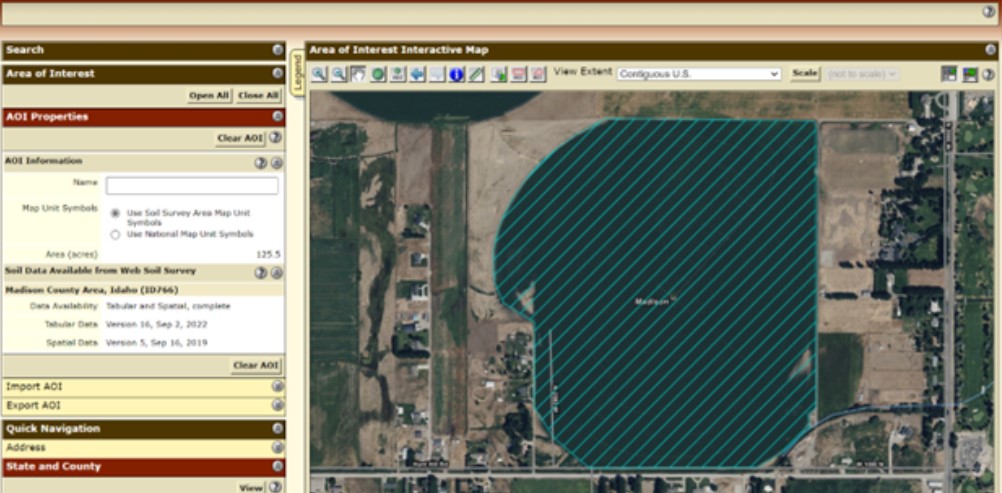
If you’ve successfully defined an area of interest, the polygon you traced will have blue diagonal lines through it, as you see above, along with an acreage count for that area. If you weren’t successful on your first attempt to create a polygon, just try again and be sure that on your last corner you double-click your mouse to complete the polygon. If you want to adjust the polygon you just created, then click on Clear AOI on the upper left. Unfortunately, you can’t edit a single point once the polygon has been fully created. This is why you have to clear the area of interest if you want to make any modifications. You can then start over until you get it to look the way you want it to.
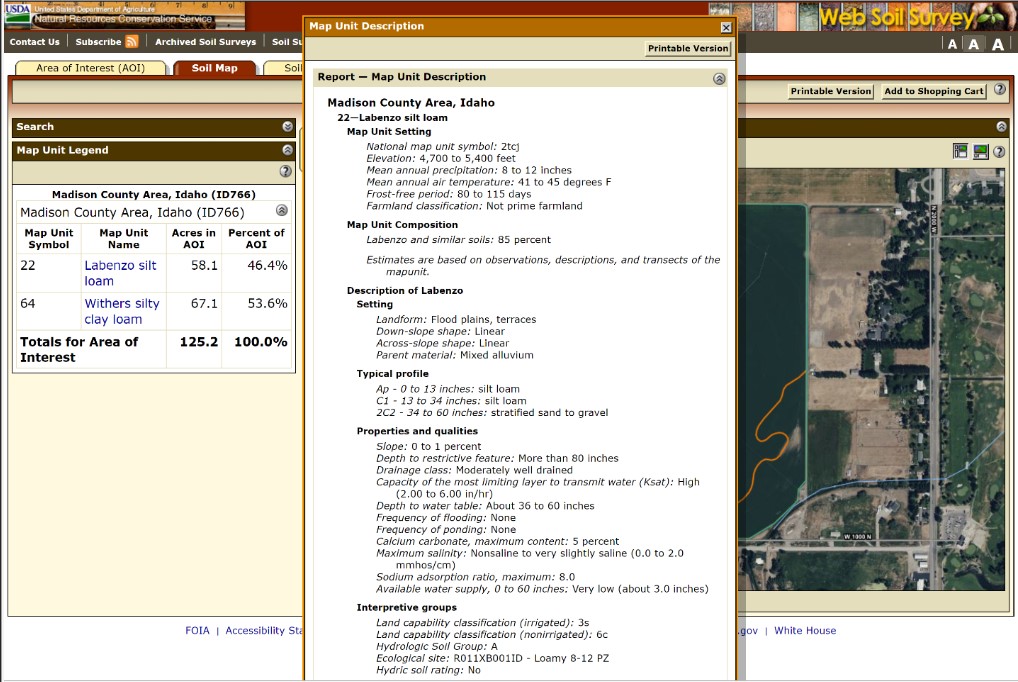
Now, let’s find out what soils are on this field. Scrolling up to the very top of the webpage, click on the Soil Map tab (see below). The blue diagonal lines on the map will disappear and be replaced by lines delineating soil boundaries. For this 125-acre field, there are just two soil map units – map unit 22, which is a Labenzo silt loam, and map unit 64, which is a Withers silty clay loam. Web Soil Survey shows the number of acres for each soil map unit and their percentage of the total. By the way, this is a great feature that the hard copy soil surveys of yesteryear could never tell you.
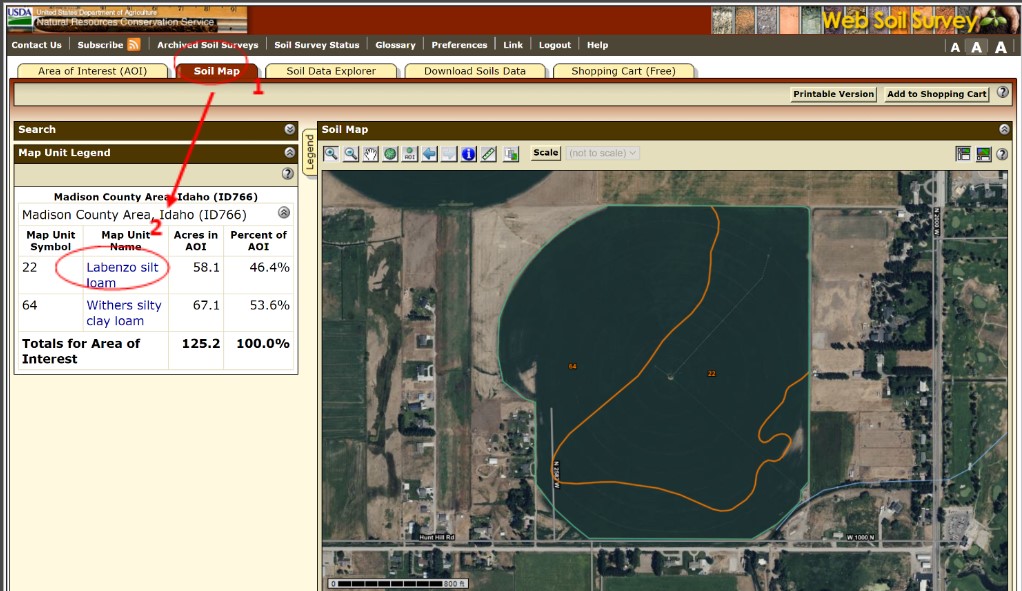
Clicking on the map unit name on the left of the screen reveals a new window with lots of great information about that soil (see below). Here we see the map unit description for the Labenzo silt loam, which includes information on where the soil is generally located, its composition, setting, typical profile soil texture, and properties.
After clicking on the X in the upper right corner to eliminate the map unit description window, go to the top of the screen and click on the Soil Data Explorer tab (see below).
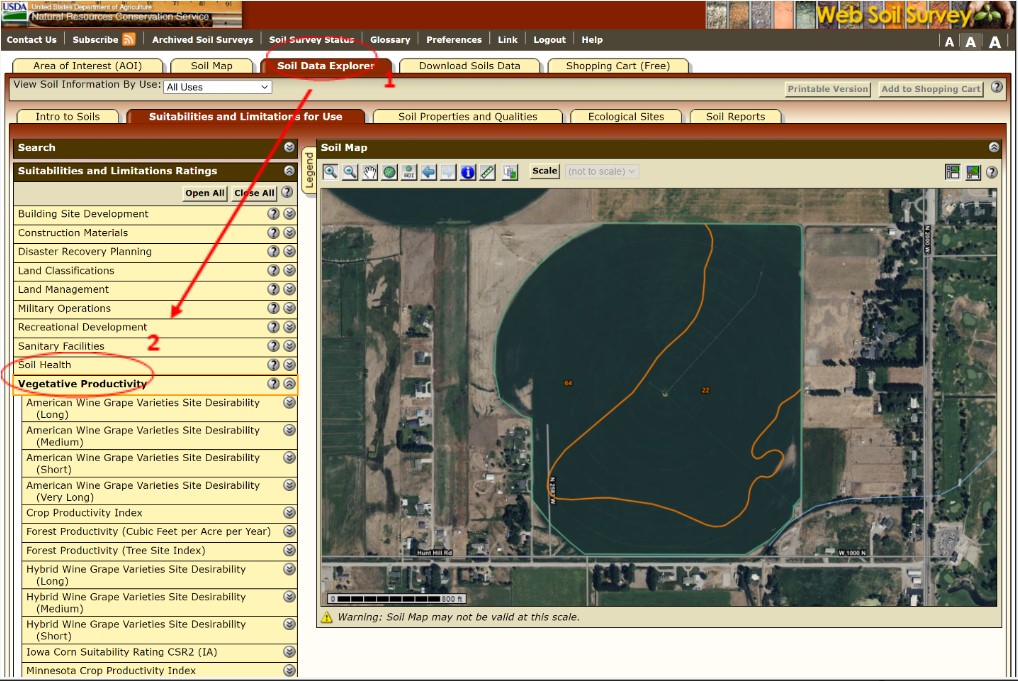
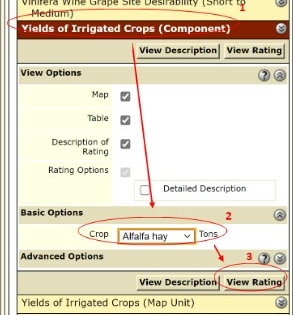
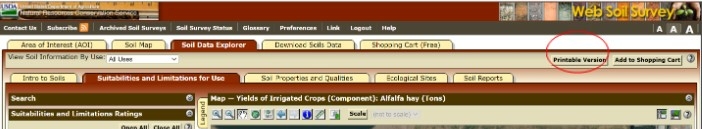
If you wanted to know what the potential alfalfa hay production is on this field, click on Vegetative Productivity (see above) under the Suitabilities and Limitations Ratings menu. This reveals a lot of different crops, some of which are not suitable for growing in this environment. Scroll down the list of different crops and click on Yields of Irrigated Crops (Component). Click on the dropdown menu and select Alfalfa Hay. Finally, click on View Rating.
Now we have a rating for alfalfa hay in tons per acre for the whole field by soil map unit. The numbers listed under the Rating column are only an estimate and should be used as a rough guide, not as numbers that are absolutely accurate. 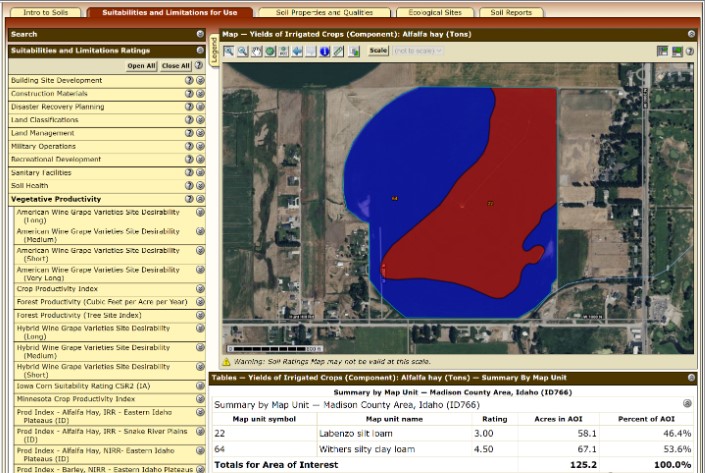
If you want to save this information for the future or print it, click on Printable Version at the top right of the page (see below).
This is just one of nearly countless ways to find soil and crop productivity information for a specific piece of land. I’ve covered maybe one percent of what Web Soil Survey has to offer. If you have additional questions on how to use this tremendous tool, just contact your local USDA-NRCS office.


 USDA NRCS
 Canva Pro
")

