Counting Plants Is Fun and Easy—And It Helps Track Your Regenerative Grazing Practices
By Lee Rinehart
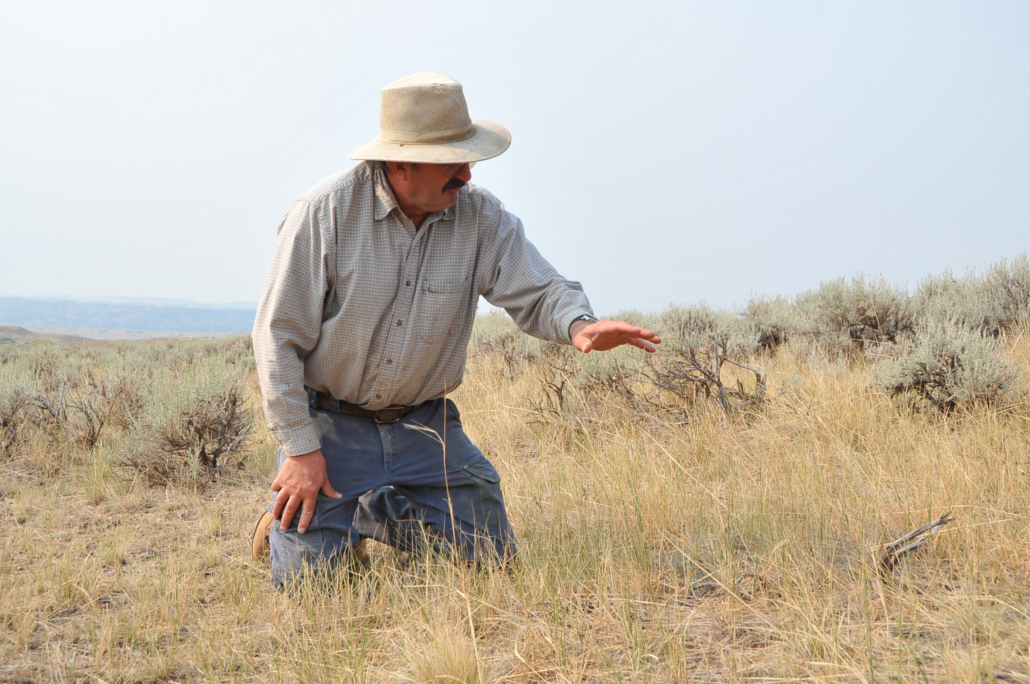
In the summer of 2004, I was a cooperative Extension agent in southwest Montana. A county agent’s job description is as big as the Montana sky… almost infinite. Sometimes organizing educational events or visiting remote ranches to take forage samples. 4H club meetings and weighing steers at the county fair. Walking barley and alfalfa fields scouting for noxious weeds or setting up grazing trials and tallying leafy spurge plants on the uplands. But walking the semi-arid rangelands with a small group of ranchers that summer taught me one of the most important lessons I would learn as a grazingland educator: we as grassland stewards need to look down more. We need to calibrate our eyes to the plant community on the land as opposed to scanning the pasture and guessing what is there.
Why? Well, knowing what plants (and how many) are growing in the pasture is crucial for making informed management decisions. To determine a stocking rate, we need to know how much dry matter is available for grazing and how much to set aside to keep the pasture healthy. This is actually a really fun exercise, and you can read more about how to do it in ATTRA’s Pasture, Rangeland, and Adaptive Grazing. But in addition to matching forage supply to animal demand, I believe it is equally crucial for us to have a good sense of the plant community that is out there, to have baseline data of the population and track it over time. With this information in hand, we can determine the effects of our grazing practices. With a few easily acquired and inexpensive tools, and just a few hours per year, we can gather data that will empirically show us whether we are making positive or negative impacts on the land.
In my work in pasture monitoring, I have found that the most important qualities to measure are canopy cover, frequency of plants, and plant composition. There are many other attributes to look at and you can go as deep as you want, but these work for me. Canopy cover is an expression of the percentage of the ground surface that is covered by plants. Frequency is a measure of the abundance and the distribution of the plant species present. And plant composition is a calculated measurement that reflects the proportion of plant species in relation to the total sampling area. These characteristics answer the question “what plants, and how many, do I have in my pasture?” It’s easy to see where this information would be useful. As land managers, we can use them to track landscape changes over time and to see if we are increasing or decreasing in plant community diversity over time given our grazing practices.
For pasture plant community monitoring, I have two favorites. One easy, and one just a little less easy but providing more accurate data. I will start with the less easy method.
The Daubenmire Method involves using a 20- by 50-centimeter quadrat frame placed along a measuring tape at permanent transects. The tape (100- or 200-foot) is stretched along a selected bearing in the pasture. Drive steel pins into the ground surface at the zero point on the tape and at the end of the transect to mark the permanent location. A T-post can be used to mark the permanent location and make it easy to find in subsequent years.
Now comes the fun part! Place a 20 x 50-centimeter quadrat frame along the tape at specified intervals, which may be every 10 feet, 20 feet, or whatever you choose. Then you can estimate the canopy coverage of each plant species within each quadrat along the transect and record the data on the Daubenmire form. From there, you can easily calculate the percent canopy cover by species, the percent frequency for each plant species, and the species composition. Voilà! You now have a baseline of information, and you can come back each year to track plant community changes.
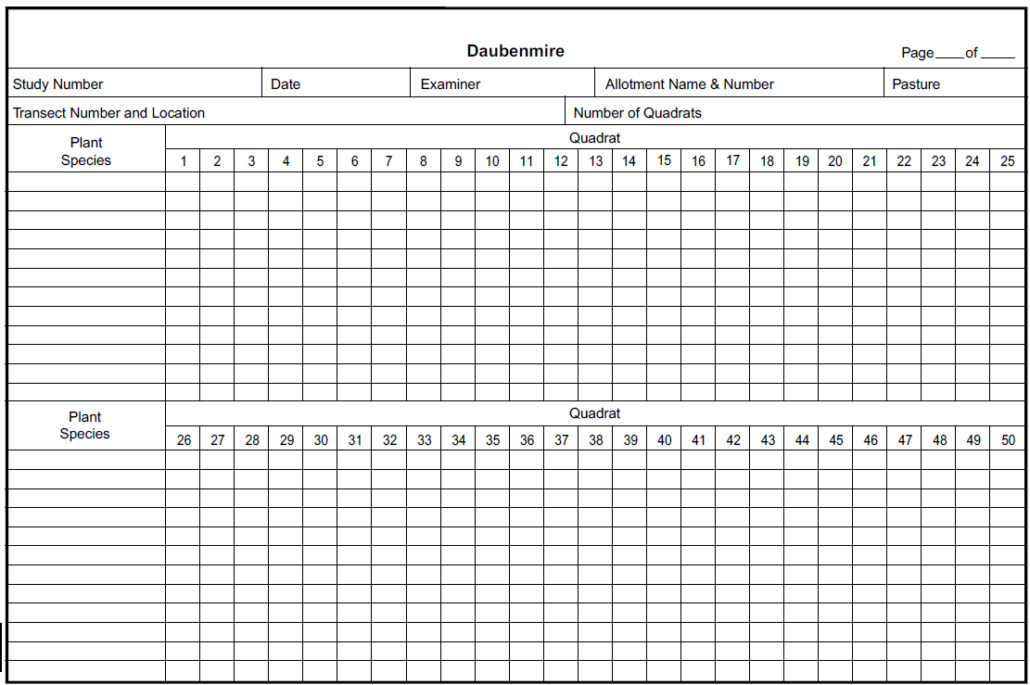
Daubenmire form. Source: BLM
I learned the Daubenmire method on Montana rangelands and it really gave me a new perspective on the landscape. As I alluded to earlier, having data on pasture plant composition has really calibrated my eye… and when I would subsequently gaze out over a landscape, I had a better idea of what, and how much, was really growing there. So, if you’re interested, I have placed a great resource from the BLM in the below that provides detailed information on how to construct a quadrat, how to lay out a transect, and how to count plants and make the calculations. Go for it!
Now, the easy (or easier) method. The Step-Point Method is a simple procedure for counting individual plants and the best part is that it can be done just by having a casual walk across the pasture. It can be done several ways, but most references suggest placing a mark on the tip of your boot (maybe a notch or a mark with a black Sharpie). I like to use a walking stick, or a pasture rule with a nail taped at the end with electrical tape. As you walk the field, every five or 10 paces you look at the boot-mark (or walking stick nail) and identify what it is touching. This could be a single grass plant of a particular species, a forb, bare ground, a rock, whatever is important for you to monitor. Each observation is called a “hit,” and you record this on the Step-Point form. Once you have taken 50 to 100 hits, you simply tally the hits for each individual species or plant types you recorded, and then calculate percent composition. For a fun variation on this, take along yard darts and randomly throw them out along your transect and record just as you would the Step-Point method.
We have put together a video where you can follow along as I perform the Step-Point Method. Watch it here.
Related NCAT Resources:
Test Driving the New LandPKS Land Monitoring App
Rangeland App: Modern Tool for Graziers
Other Resources:
Sampling Vegetation Attributes
This blog is produced by the National Center for Appropriate Technology through the ATTRA Sustainable Agriculture program, under a cooperative agreement with USDA Rural Development. ATTRA.NCAT.ORG.
